(forked from the team’s original writeup here)
We build Out for Justice in 24 hours at the Bayes Impact Hackathon, using data from the San Francisco Police Department. Out For Justice is an an interpretable, customizable and interactive decision support system to help SFPD optimize police patrols. Out for Justice allows the user to set their own objectives and isn’t simply a black box algorithm that outputs a solution.
The idea is simple: minimize response time to crime–or 911 at least calls. But different kinds of crime happen in different places in San Francisco. And police cars/patrols are a limited resource.
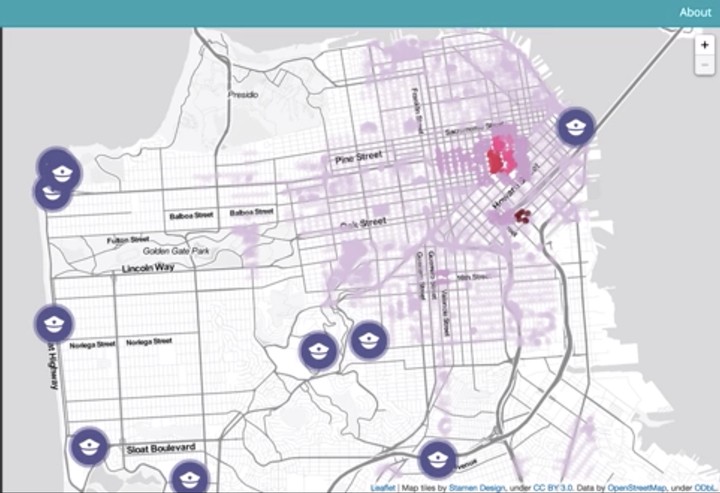
Out for Justice allows the user to evaluate potential positions for patrol cars–if someone calls in a violent crime and my cars were set up like this, how long would it take to respond? It allows you to prioritize your response to different types of crimes using custom weights. Responding a minute later to investigate a broken window may be much less costly than arriving late on the scene of a crime in progress.
Finally, Out for Justice allows users to set car positions. Based on the custom weights and number of patrol cars, Out for Justice optimizes patrol car placement using an algorithm we call MetroPolice-Hastings.
HOW DOES IT WORK?
Out for Justice is made of three components. First, we science some data. We take two years of SFPD 911 call data and use it to predict where future 911 calls are likely to come from. Second, real map data from Open Street Maps is used to simulate travel times from SF patrol cars to a call. Second, we optimize stuff. We take map data from Open Street Maps and use it to simulate travel times from SF patrol cars to a call. Finally, a simple interface makes interacting and drawing insights from Out for Justice easy.
BOOSTING FOR JUSTICE
The beating heart of Out for Justice is some machine learning. We took a data set of two years of 911 calls in San Francisco that had attached latitude/longitude coordinates, discretized the city into a grid and trained boosted Poisson regression trees to predict the probability of a 911 call at each position. This makes some strong assumptions about the underlying process that are wrong, but hey, it’s still useful and we only had 24 hours! After we trained the trees they could, in principle, predict at any latitude/longitude location in SF so we predicted Poisson arrival rates for every node in street graph that we built using Open Street Maps.
We tried several other approaches including 2d kernel density smoothing but found that the boosted trees were by far the best performing. We used the R package gbm to do the training.
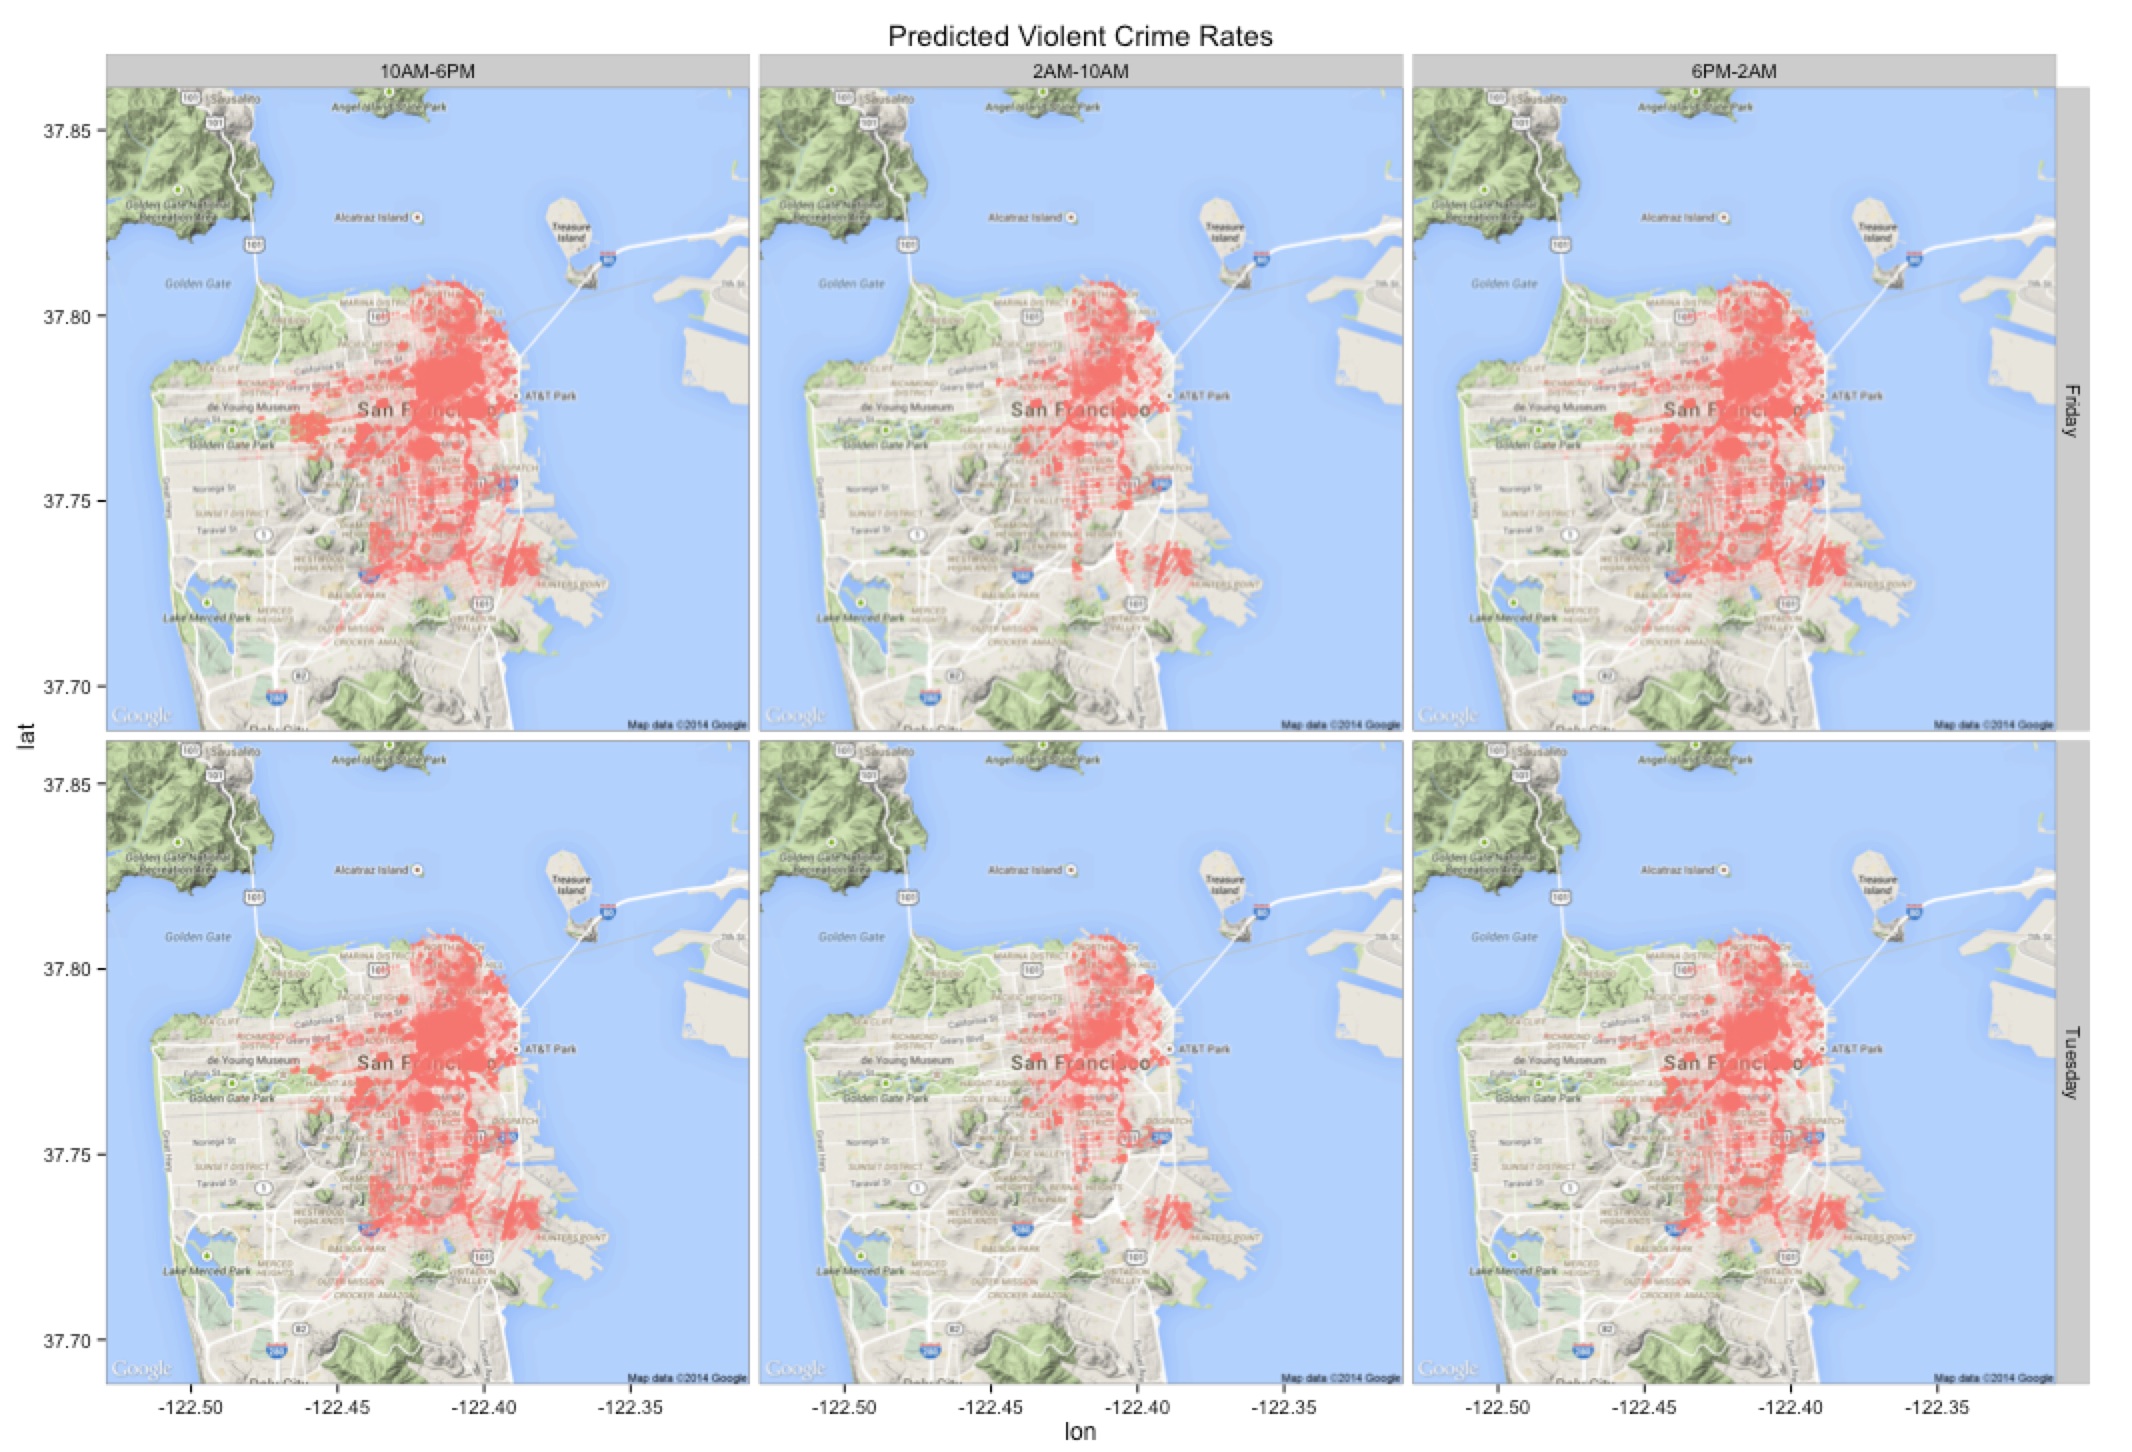
For the initial project we focused on predicting three broad categories of crime: violent crimes (assaults, arson and forcible sex offenses), property crimes (burglary, vandalism, larceny and vehicle theft) and substance-based crimes (drunkeness or drug/narcotic). Our exploratory analyses also told us that it was a good idea to split the data by time into 3 epochs: nighttime (2AM-10AM), day time (10AM-6PM) and evening time aka party time (6PM-2AM).
Our analyses find some interesting patterns in the data. All the plots are done using the excellent R package ggmaps. There are definitely weekend/weekday patterns as well as daily cycles in the day (see below). The models and data are up in the GitHub directory above if you want to play with them!
COMPUTING THE COSTS
So now we have probabilities of calls occuring at each node of the graph that is San Francisco. We can now take a set of patrol cars located at various points in the graph and calculate a score for that position, the score we use in the current version is an expected travel time given the way that calls are expected to come in both spatially (where does the call come from?) and temporally (how likely is a particular type of call?). The key innovation is the ability for the user to specify in the UI which types of calls are really important to respond to quickly and which ones are the kind where a minute’s delay may not hurt things very much.
The current beta version only allows for random initial placements of a user-specified number of patrol cars, the easiest next feature to add is the ability to place the cars manually.
METROPOLICE-HASTINGS OPTIMIZATION
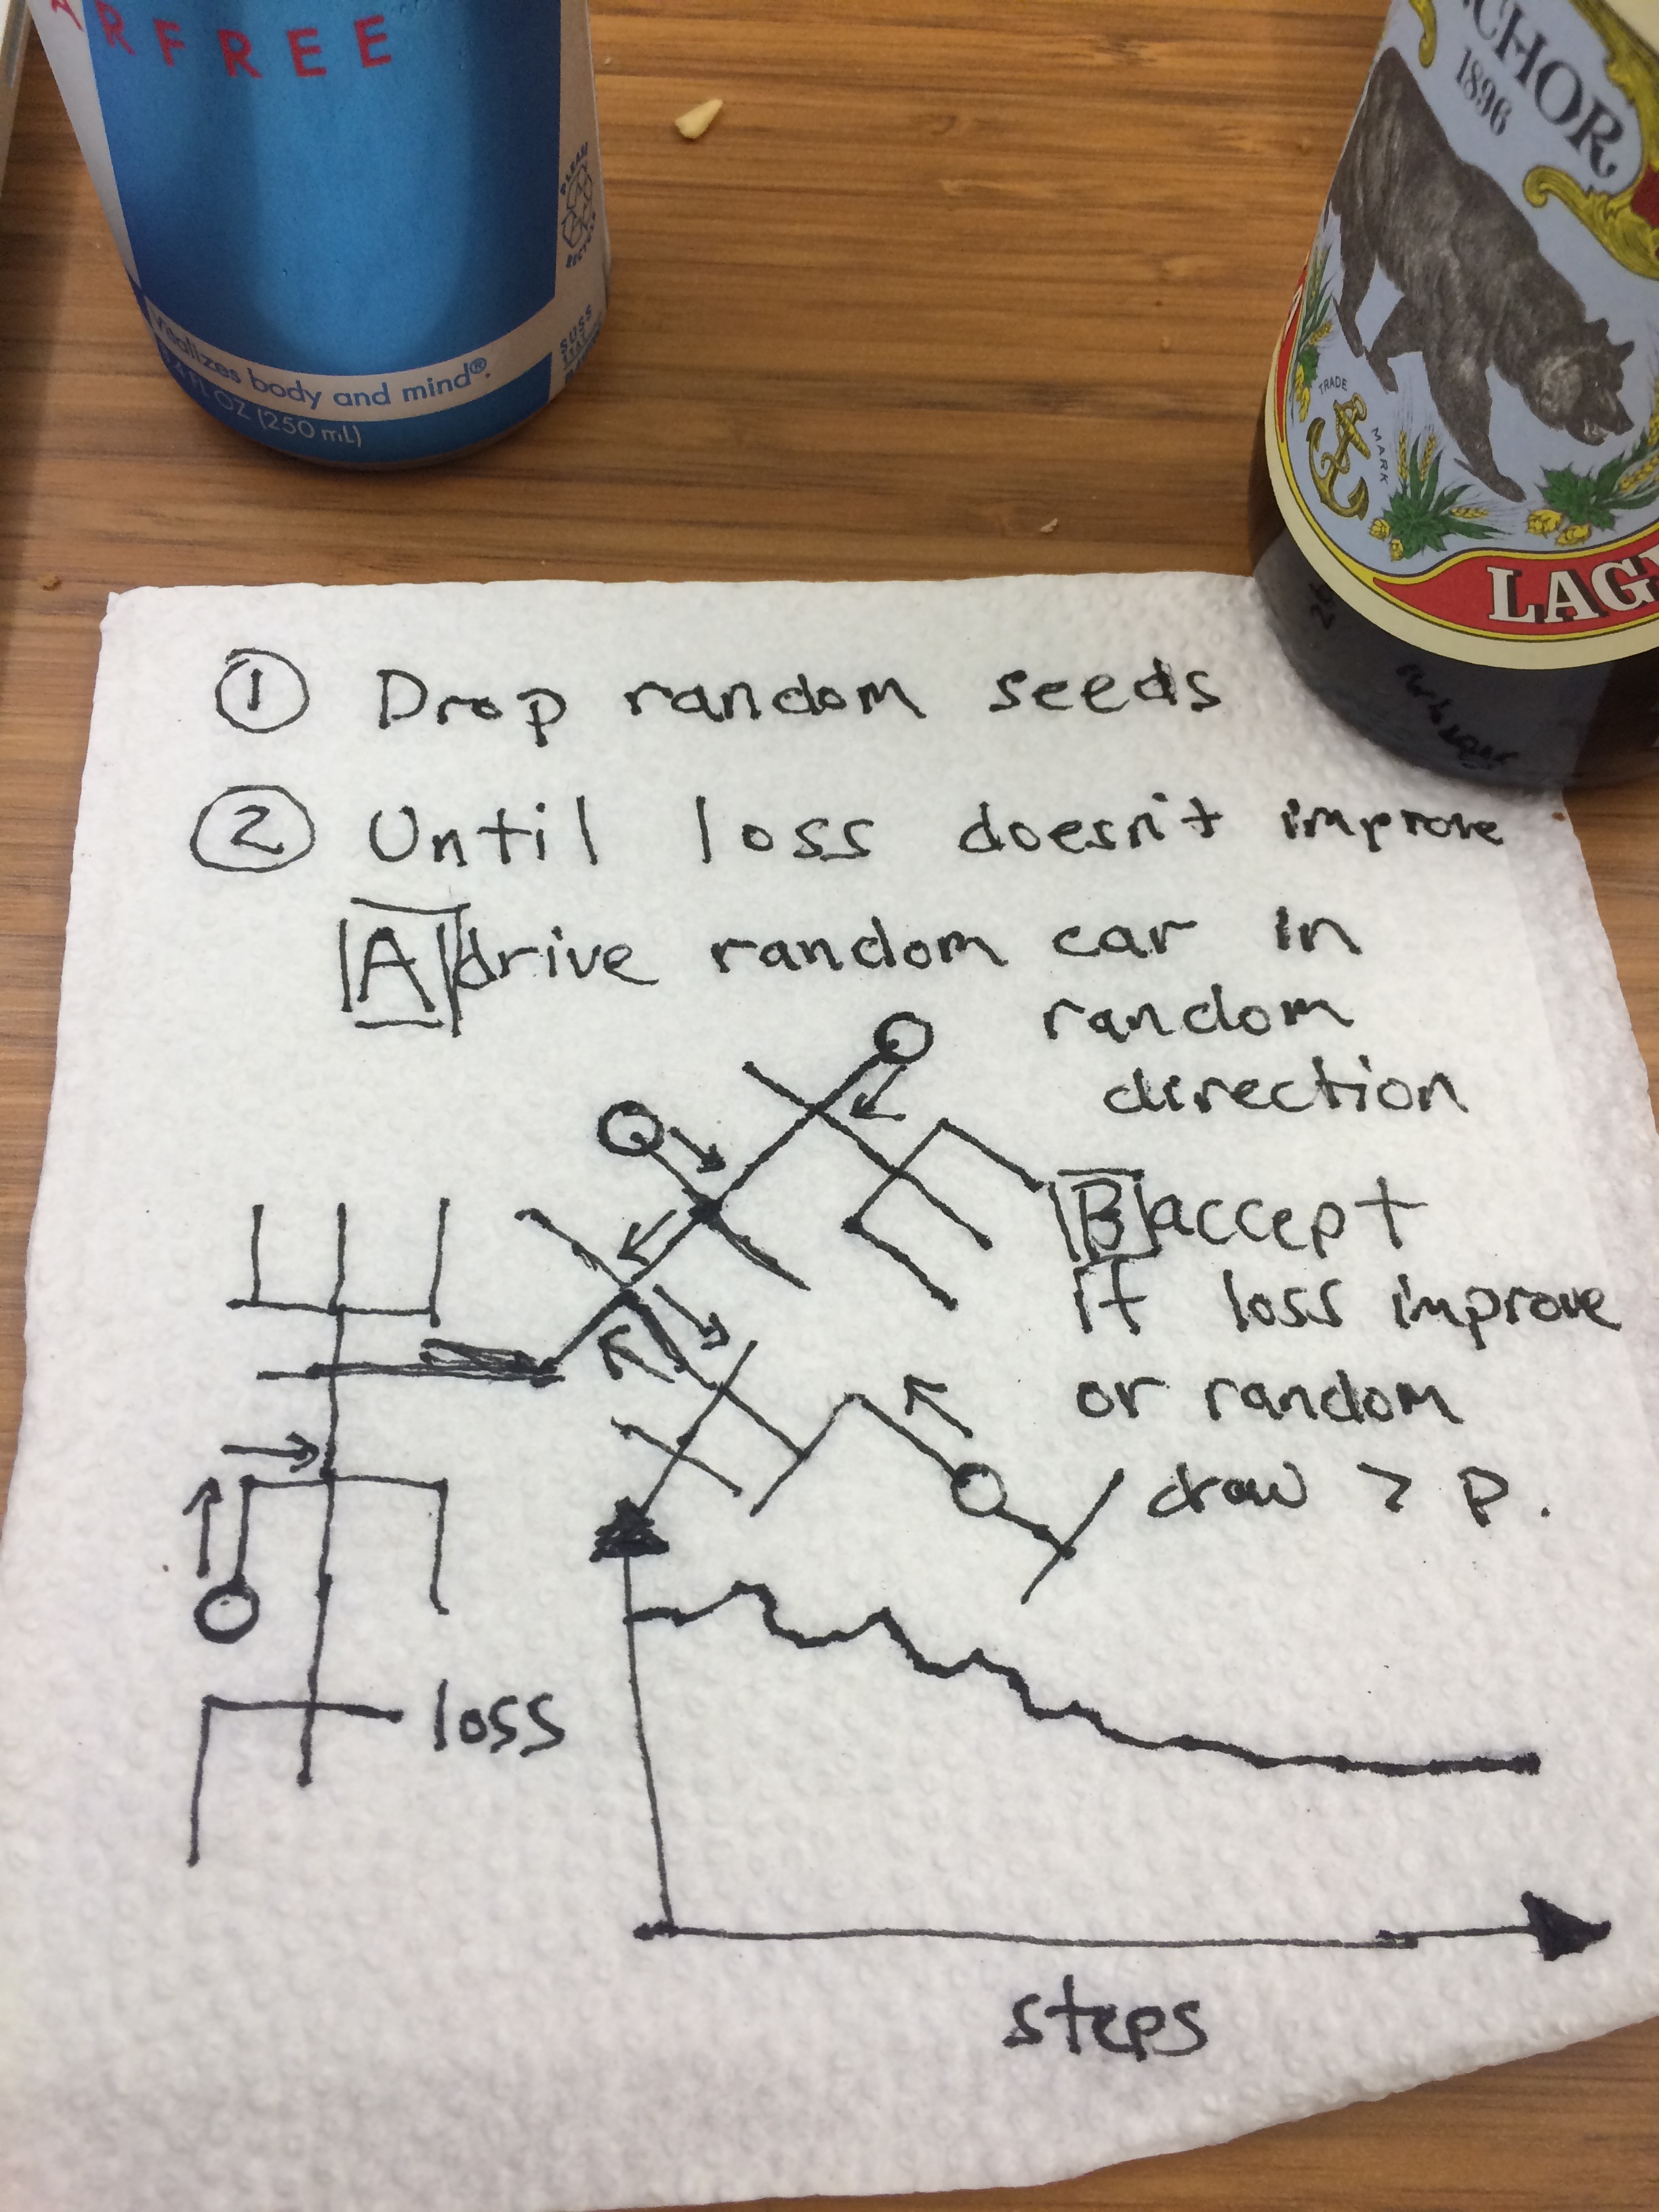 The final core component of Out For Justice is an optimization algorithm. Given an existing car placement, it is natural to ask "can we do better?" We use a version of the Metropolis-Hastings algorithm to compute the answer to this question: first, we choose a random car to move a random distance on the graph.
To add stochasticity to this algorithm with a small probability we keep this move no matter what. With the complementary probability we do something smarter: we ask whether this move improves the weighted response time. If this move improves the response time by a meaningful amount, we keep it. If it doesn’t, we revert it and try something else. This algorithm has a few parameters to tune, namely the probability of keeping any move and the threshold of improvement that we require to count the move as a success. The current version makes no pretense of having these parameters set optimally, though we did play with them somewhat.
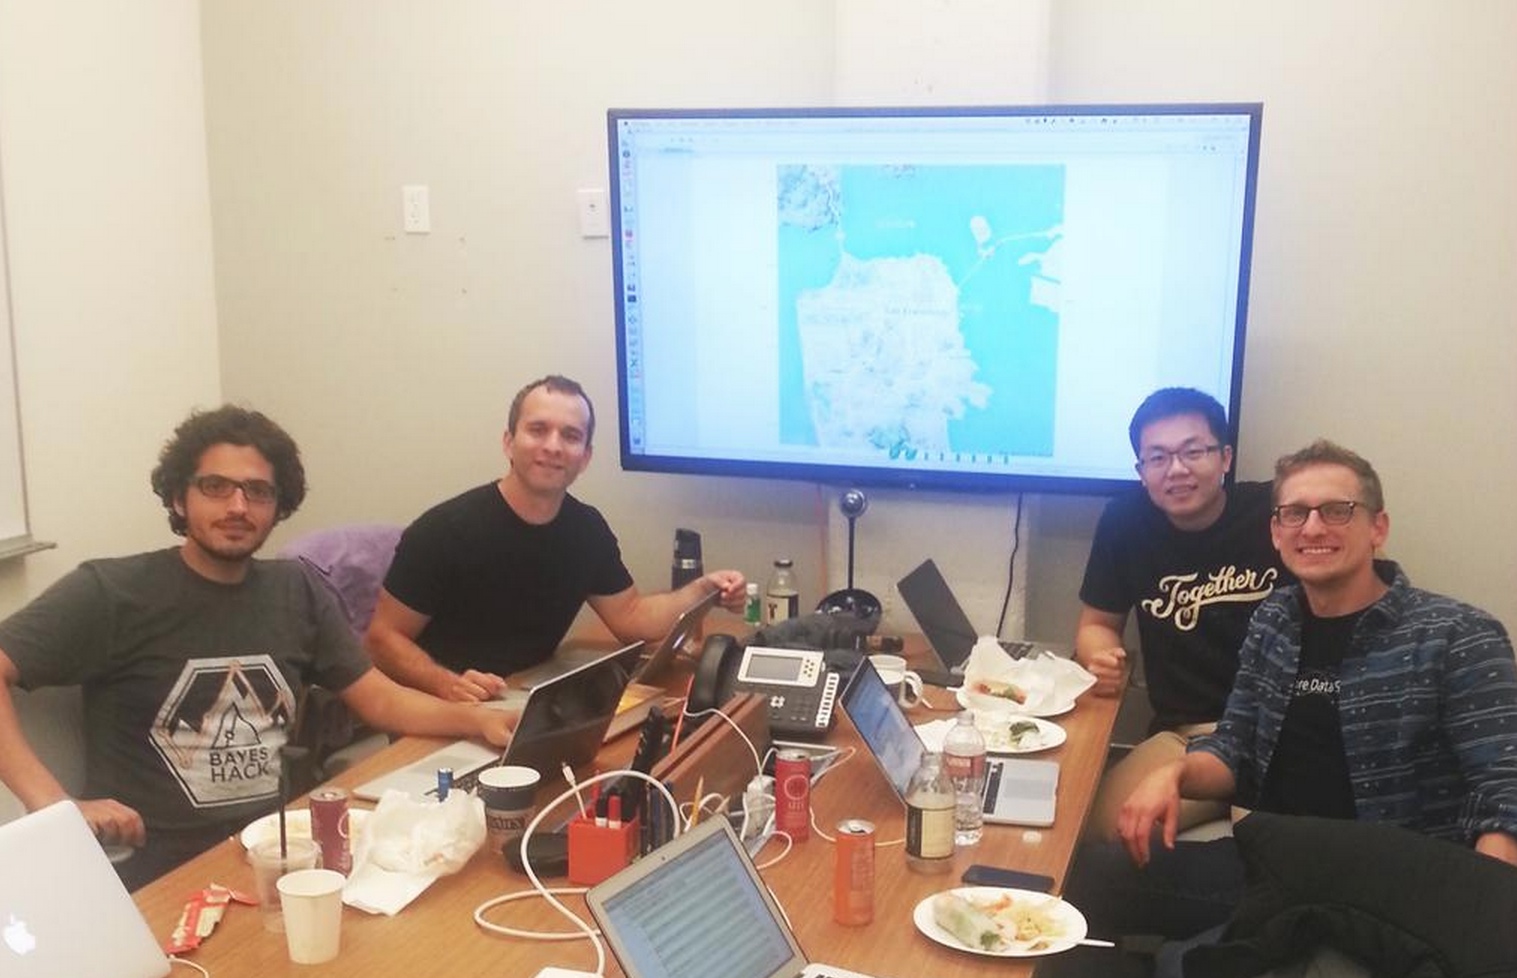
THE OUT FOR JUSTICE TEAM
Ta Virot Chiraphadhanakul @tvirot
Sean J. Taylor @seanjtaylor
Alex Peysakhovich @alex_peys
Solomon Messing @SolomonMg
UPDATE: Nice coverage on Mashable of the entire hackathon! Check out the winning hackathon project.