Sol Messing
Sol Messing
Home
Publications
Posts
Projects
Media
Bio
Tech Stack
Disclosures
Contact
CV
Light
Dark
Automatic
Posts
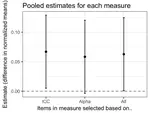
Replication of 'Bias in the Flesh'
Replication of Study 2 in “Bias in the Flesh: Skin Complexion and Stereotype Consistency in Political Campaigns”
Sol Messing
Oct 16, 2017
14 min read
Ideologically diverse news, an agenda for future research
Earlier this month, we published an early access version of our paper in ScienceExpress (Bakshy et al. 2015), “Exposure to ideologically diverse news and opinion on Facebook.
Eytan Bakshy
,
Sol Messing
Apr 24, 2015
11 min read
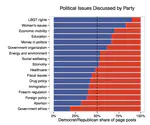
When to Use Stacked Barcharts?
Yesterday a few of us on Facebook’s Data Science Team released a blogpost showing how candidates are campaigning on Facebook in the 2014 U.
Sol Messing
Last updated on Nov 1, 2015
4 min read
Insight From Cleveland And Tufte On Plotting Numeric Data By Groups
After my post on making dotplots with concise code using plyr and ggplot, I got an email from my dad who practices immigration law and runs a website with a variety of immigration resources and tools.
Last updated on Mar 5, 2017
13 min read
Working with Bipartite/Affiliation Network Data in R
Data can often be usefully conceptualized in terms affiliations between people (or other key data entities). It might be useful analyze common group membership, common purchasing decisions, or common patterns of behavior.
Sol Messing
Last updated on May 12, 2020
17 min read
«
Cite
×